Image of a drawing depicting parts of a community or town, with silhouette outlines of  people that are clustered together in different sized groups. Each group is labeled. The smallest 'group' is one person, and the label reads Individual.  The two-person group is labeled Interpersonal, the next group has several people in a tight cluster, and is labeled Community. The last group has several people spread out a bit, and is labeled Society. The purple color of the labels gets darker as the group-size gets larger.  The groups of people are set in different parts of the community or town, near a playground, a school, an apartment building, an office building and a hospital, with light-yellow accents highlighting each place. There are green trees and vegetation around, and birds in the blue sky.  Underneath the town is a layer of grey rocky soil, and beneath that is a layer of blue water with text that reads 'Groundwater Theory of Advantage and Oppression'.  There is a large magenta square labeling the entire image with the title 'Interactive Theory of Change.'  There is blue text at the top of the image that reads, 'We know that intimate partner violence (IPV) is about power and control at the interpersonal level.' In bigger, bold text, the next sentence says, 'Preventing IPV must involve addressing harmful power and control dynamics that exist at the societal level.'

Key Strengths

Focusing on building these key strengths that address clusters of risk and protective factors is key to preventing IPV in your community.

Strategies


Turning theory into action: Real world tools for implementing IPV prevention programs in your community.


Prevent Violence NC Mission

Bringing violence prevention theory together with practical strategies that can make measurable improvements in the lives of all North Carolinians.


History and Founding Partners

Image of the cover page of the North Carolina Strategic Plan for Preventing Injuries and Violence from 2009 - 2014, entitled "Building for Strength." The text on the cover page is in blue in white blocks, and in the background is a photo of a red and brown brick wall.Prevent Violence NC (PVNC) is currently curated and maintained by the North Carolina Coalition Against Domestic Violence, but it is the product of a highly a collaborative effort between five statewide partner agencies.

PVNC began in 2009 when the North Carolina Division of Public Health, Injury and Violence Prevention Branch published a 5-year strategic plan to reduce the burden of injury and violence across the state, called Building for Strength. The Violence Prevention Goal Team formed to oversee the violence-related goals of the 2009 – 2014 plan and identified the need to define, provide data, and recommend strategies to address the following prioritized violence outcomes:

  • Child maltreatment
  • Intimate partner violence
  • Sexual violence
  • Suicide
  • Youth violence

With increasing recognition of the links between each of these forms of violence, the team chose to grant special attention to prevention strategies capable of influencing more than one of these outcomes; such strategies are more likely to maximize use of available resources, foster new partnerships, and increase public health impact.

PVNC is intended to facilitate coordination of strengths-based violence prevention efforts across agencies in North Carolina and at multiple levels of the social ecological model. It provides summaries of the research, strategies, and resources available to support communities in coordinated violence prevention and health promotion efforts.

The PVNC shared risk and protection framework continues to shape state-wide collaborations and prevention work today:

  • Current Injury and Violence Prevention Strategic Plan
  • Injury Free NC Academy
  • North Carolina Violence Prevention Coordinating Team

Founding Partners

Image of the logo for the North Carolina Coalition Against Domestic Violence. On the left is a dark purple circle with a white branch and leaves growing across it to the right. Next to the circle is dark purple text that reads 'NCCADV' and spells out the full name of the organization below it. North Carolina Coalition Against Domestic Violence is the statewide non-profit membership organization providing support services to local domestic violence agencies and allied professionals. NCCADV’s purpose is to strengthen the network of people working to end domestic violence in NC.

Image of the logo for North Carolina Coalition Against Sexual Assault, with yellow and teal lettrs North Carolina Coalition Against Sexual Assault is the sole statewide expert working to end sexual violence and human trafficking through education, advocacy, and legislation. NCCASA provides prevention education, intervention resources, and public policy to end all forms of sexual violence.

Image of the logo for the North Carolina Department of Health and Human Services, white letters on a grey background next to the State Seal of North Carolina North Carolina Department of Health and Human Services, Division of Public Health, Chronic Disease and Injury Section works to reduce death and disabilities through education, policy change and various services. CDI’s goal is to help all North Carolinians develop healthy and safe communities and health systems to prevent and control chronic diseases and to eliminate health inequities.

Image of the logo for the Injury and Violence Prevention Branch of the North Carolina Department of Health and Human Services. Logo text is purple and blue. North Carolina Department of Health and Human Services, Division of Public Health, Women’s and Children’s Health Section works to assure, promote and protect the health and development of families with emphasis on women, infants, children and youth. WCH programs place a major emphasis on the provision of preventive health services beginning in the pre-pregnancy period and extending throughout childhood.

Image of the logo for the North Carolina Department of Public Safety. Logo has black lettering on a white background, and behind the letters DPS is a drawing that combines the red, white, and blue NC state flag with the outline of a shield-shaped badge. North Carolina Department of Public Safety, Division of Adult Corrections and Juvenile Justice is responsible for the care, custody and supervision of all adults and juveniles sentenced after conviction for violations of North Carolina law. For juveniles, the focus is on strengthening families, promoting delinquency prevention, supporting core social institutions, intervening immediately and effectively when delinquent behavior occurs, and identifying and controlling the small group of serious, violent, and chronic juvenile offenders in the local communities.


Methods

A variety of methods were used to construct the database of resources, and strategies, including:

Academic literature review  to identify risk and protective factors shared by the five prioritized forms of violence

  • Articles were evaluated for the following criteria:
    • Published in a peer-reviewed journal
    • Demonstrated an association between a risk/protective factor and one or more violence outcomes OR
    • Were determined by researchers to have a strong theoretical linkage to one or more violence outcomes
  • Risk and protective factors were prioritized if evidence was found to support their association with 2 or more of the 5 prioritized violence outcomes
  • Conceptually similar risk and protective factors were combined into five themes to simplify strategy selection

Interviews with key stakeholders to assess current NC state plans to address each of the 5 prioritized violence outcomes. Interview were also later conducted with local programs implementing evidence-based or evidence-informed strategies to address one or more of the shared risk and protective factors

Academic literature search to identify evidence-based and evidence-informed strategies to address the shared risk and protective factors

Web search to identify resources to support planning, implementation, evaluation, and funding of relevant strategies

Development of strategy inclusion criteria
Strategies were included if the evidence to support their effectiveness met the following criteria to be described as practice-based, evidence-based, or evidence informed. The strategy and programs listed on PVNC are not exhaustive. They are a starting point from which to begin developing a prevention plan relevant for your community.


Evidence Categories

PVNC About Key Takeaways

To be considered for inclusion, strategies and programs meet the following criteria:

Practice-based:

  • programs or strategies that have not yet been rigorously evaluated but are widely considered culturally appropriate, relevant, and effective within the communities in which they are employed OR
  • have been rigorously evaluated in a non-research setting

Evidence-based:  Multiple randomized controlled trials (RCT) or quasi-experimental designs show effectiveness in more than one setting; considered the “gold-standard” of research evidence

Evidence-informed: Includes programs often labeled as “promising” or “emerging” in program databases; programs demonstrate:

  • Some evidence of effectiveness/expected preventive effect
  • Non-experimental design/sound theory only
  • Replication without evaluation
  • Promise for real-world application

Strategies should not show any indication of creating harm, including increasing/creating disparities, based on criteria adapted from North Carolina Smart Start and Centers for Disease Control and Prevention (CDC).


Contact

Contact us for training or technical assistance with your own violence prevention efforts!
1000 characters left


Image of the logo for the North Carolina Coalition Against Domestic Violence. On the left is a dark purple circle with a white branch and leaves growing across it to the right. Next to the circle is dark purple text that reads 'NCCADV' and spells out the full name of the organization below it.

Use this page to paste and style content, when needed to obtain html code for pasting that style in another location. Will be seldom used.


Also, look at the code view to see the code used to create the sliders:

In code view, within brackets {} enter the title as below.  Also include the text class="blue solid icon" .

The text following  {/...  will appear as a normal paragraph.

PVNC Key Strengths Key Takeaways

Overview

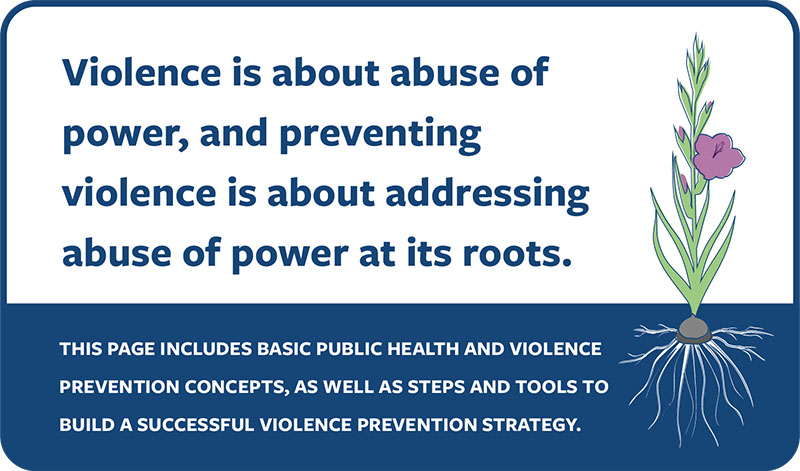
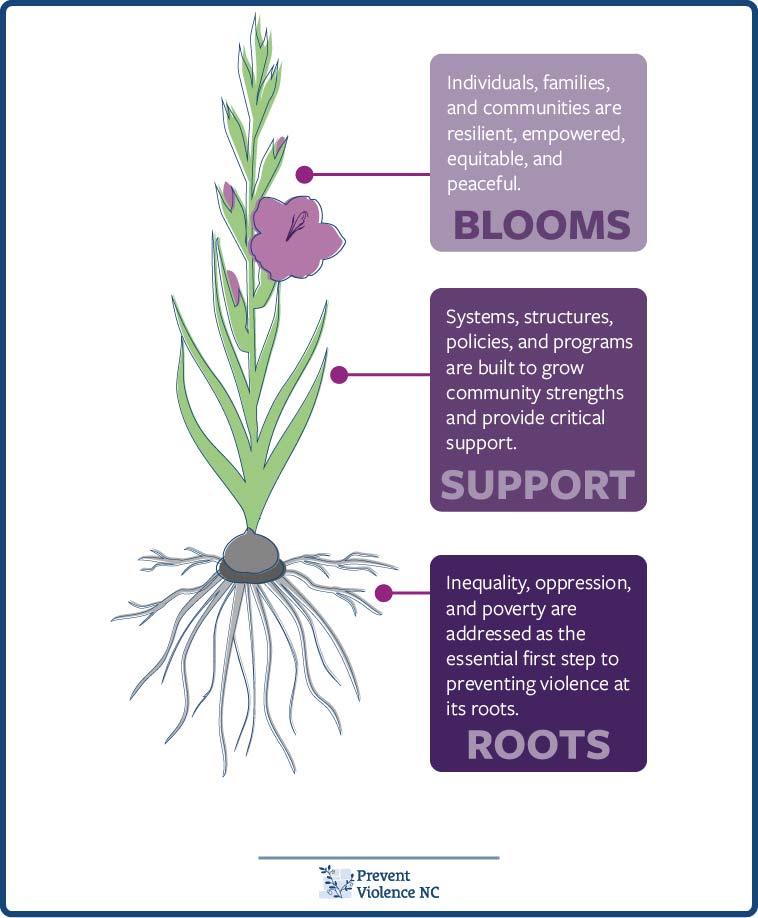
Preventing violence requires fixing social power imbalances at the deepest level – the level the Racial Equity Institute and NCCADV call the Groundwater level. The ‘groundwater’ can be understood as the overarching culture and structure of our society.

Power inequities in the groundwater determine the social context of people’ everyday lives through institutions and systems - such as education, health care, the built environment, community context, and employment. In the field of public health, these are called the social determinants of health.

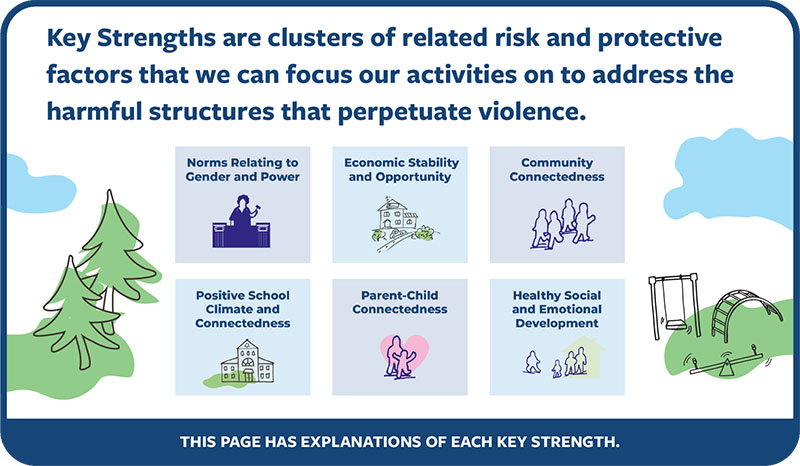
These systems and institutions influence people in specific ways that can protect against violence perpetration (protective factors) or put people at risk for doing harm (risk factors). We’ve grouped these risk and protective factors into six related clusters that we call Key Strengths.

We believe that communities working to improve the Key Strengths in a coordinated way across all the social determinants of health and levels of the social ecology can function to “clean up the groundwater.” In other words, working together across systems to shift power inequities in our structures and culture can begin to address violence where it begins.

Part of the PVNC logo which shows a dark blue sprig of honeysuckle vine growing in front of a partially-constructed brick wall that is a soothing light-blue.And bolstering the Key Strengths is how.

Each Key Strength is a cluster of related risk and protective factors that are important for preventing all five of NC’s prioritized violence: Child maltreatment, domestic violence, sexual violence, suicide, and youth violence.

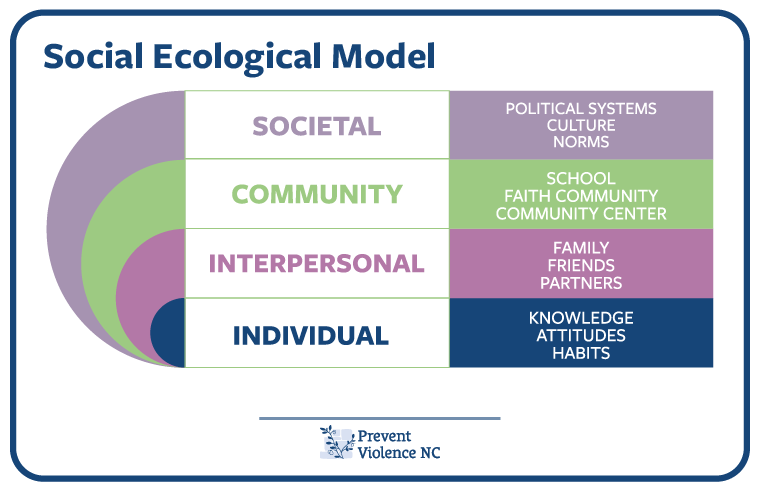
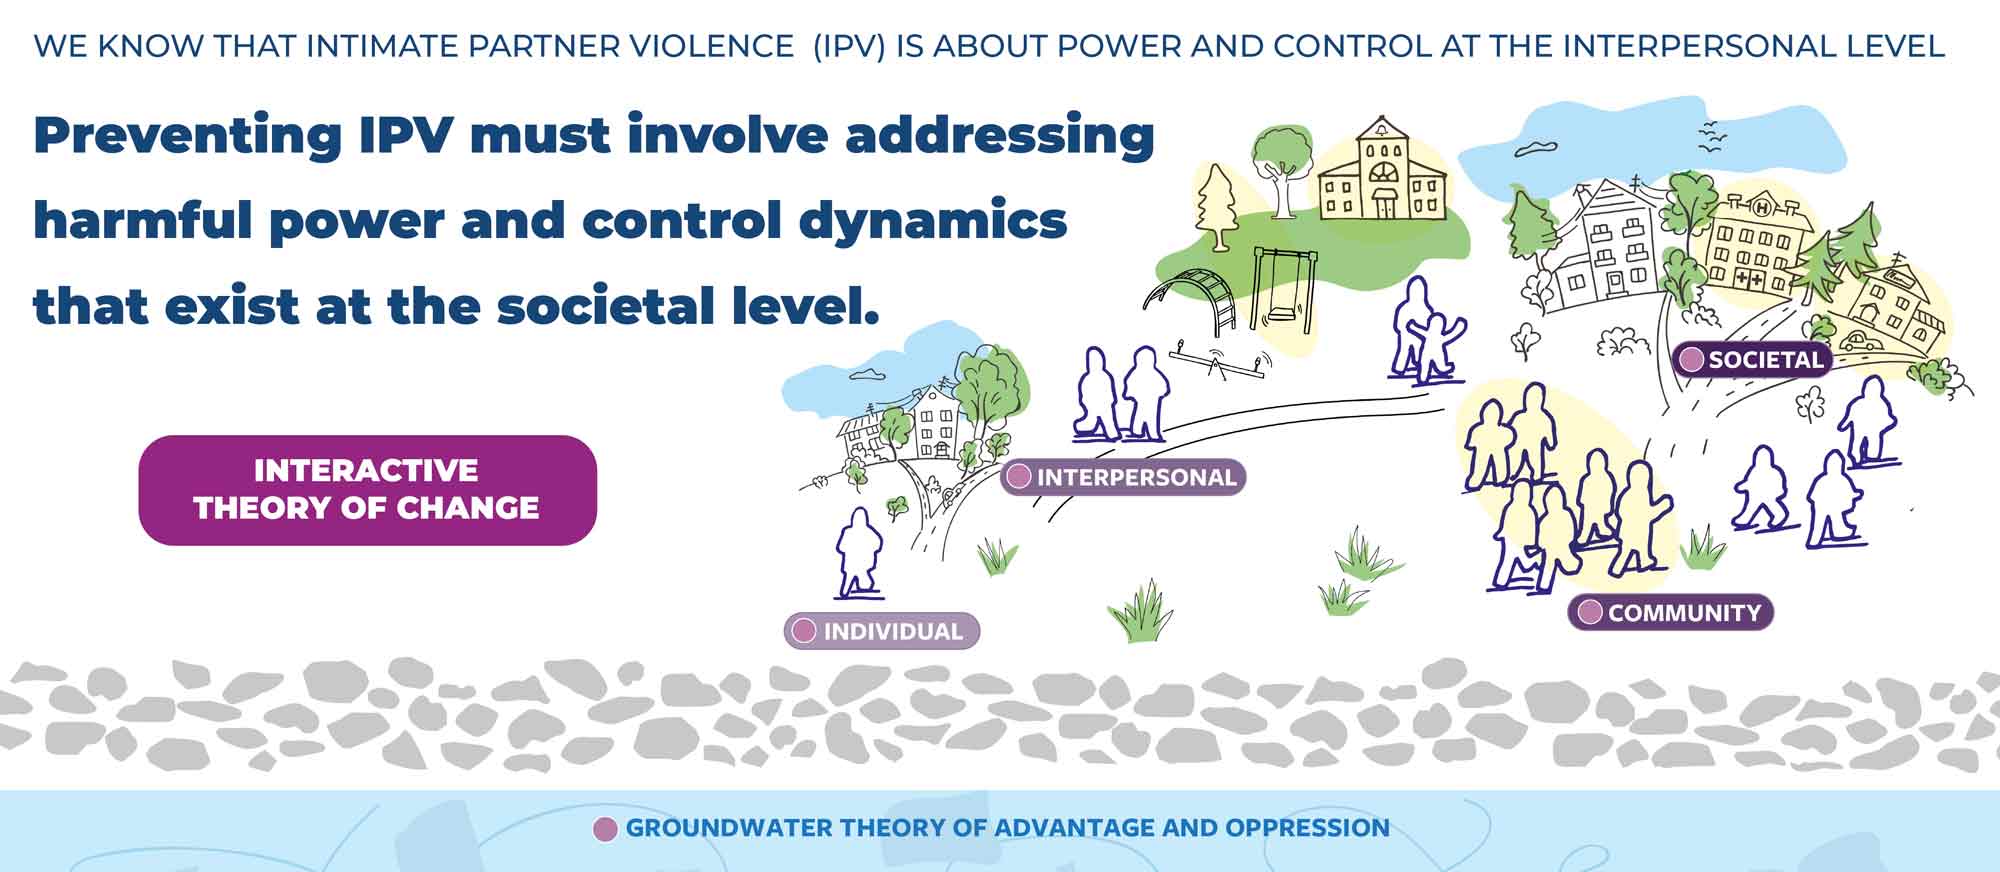
Strategies to bolster any of the Key Strengths can be implemented across all levels of the social ecology, but they do have different ‘home’ levels of influence. For example, Healthy Social and Emotional Development is a cluster of risk and protective factors that occur at the individual and interpersonal level, but there are strategies to strengthen them that can be implemented in communities and through social policy.

One example of a societal level intervention that strengthens the individual-level risk and protective factors is the Mental Health Parity and Addiction Equity Act of 2008. This law generally prevents health insurance plans offering mental health or substance use disorder benefits from restricting coverage for those benefits in comparison to their coverage of medical and surgical health services. Meaning, if a plan offers mental health coverage it should be comparable to coverage for medical care. The Affordable Care Act strengthened this requirement by including mental health and substance use disorder care in the ACA’s list of 10 Essential Health Benefits that most health plans must offer. Thus, access to mental health services and treatment for substance use disorders significantly increased in communities all across the country – a national level intervention improved several risk and protective factors that fall at the individual level under the key strength, Healthy Social and Emotional Development.

In the descriptions below, the 'home' sphere of influence is listed under the name of each Key Strength - but on the Strategies and Resources sections of the website you can learn more about strategies to implement at across the social ecology (click on image to see larger view).

Large thumbnail of a .pdf document, which is a table that cross-references the Key Strengths with their associated risk and protective factors across the social-ecology, and lists the related forms of violence. Please download the .pdf file for details.

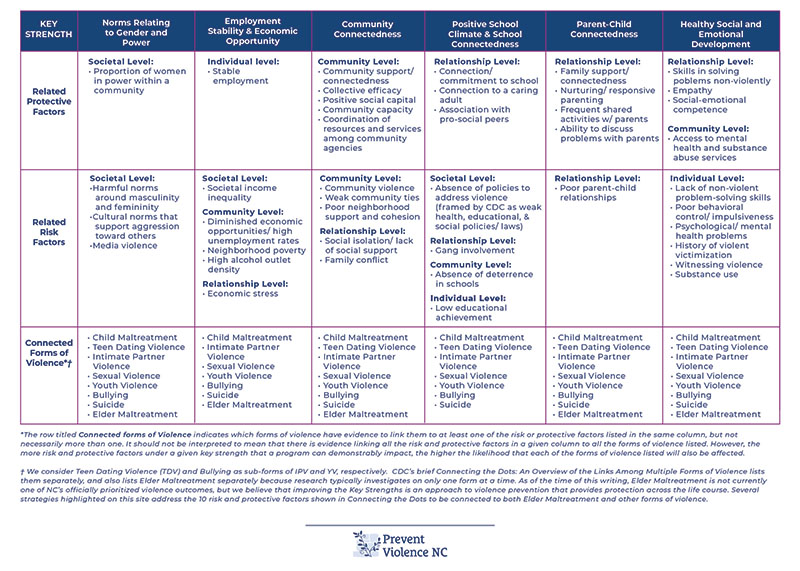
Download this table as a PDF file.


Definitions of the five violence outcomes prioritized for prevention in NC


Norms Related to Gender and Power

Levels of the Social Ecology:

 Outline of a dark purple circle with white background, inside is a drawing of a building with a car driving in front of it and green pine trees in the background. This icon symbolizes the Societal Level of the Social Ecological Model, explained elsewhere on the site.SocietalOutline of a dark purple circle with white background, inside is a drawing of the silhouettes of six people clustered together.  This icon symbolizes the Community Level of the Social Ecological Model, explained elsewhere on the site.Community

Norms Related to Gender and Power

Gender is a set of social and cultural roles that are typically assigned at birth based on an infant’s external sex characteristics, such as genitalia.

Gender roles vary across cultures, and the two most common genders are woman/female and man/male, although there are many more possibilities some of which are unique to specific cultures. For example, Muxe people are a unique and valued part of the Zapotec community in Oaxaca, México.

The Canadian Institutes of Health Research note that gender “influences how people perceive themselves and each other, how they act and interact, and the distribution of power and resources in society. Gender is usually conceptualized as a binary (girl/woman and boy/man), yet there is considerable diversity in how individuals and groups understand, experience, and express it.” This Map of Gender Diverse Cultures has more information about the history of gender diversity around the globe.

The culturally-specific rules and expectations for behavior and self-expression associated with these social roles known as gender norms. Sometimes norms are explicit and formal – often, these are clearly taught by authority figures as “what people should do.” But there is another type of social norm that is subtle, informal – yet very influential, which can be understood as “the way the world is.” Both are important to address when implementing strategies under this Key Strength.

For more resources on Norms Related to Gender and Power, visit our Resources section.


Economic Stability and Opportunity

Levels of the Social Ecology:

Outline of a dark purple circle with white background, inside is a drawing of a building with a car driving in front of it and green pine trees in the background. This icon symbolizes the Societal Level of the Social Ecological Model, explained elsewhere on the site.SocietalOutline of a dark purple circle with white background, inside is a drawing of the silhouettes of six people clustered together.  This icon symbolizes the Community Level of the Social Ecological Model, explained elsewhere on the site.Community

Economic Stability and Opportunity

Economic Stability and Opportunity can be understood as having enough material resources to provide for your, and your family’s basic needs, and ample, viable opportunities to improve your economic status.

In terms of employment, it is having a steady job that pays a living wage or better, and ample opportunity in your neighborhood for everyone who needs such a job to obtain one.

For more resources on Economic Stability and Opportunity, visit our Resources section.


Community Connectedness

Levels of the Social Ecology:

Outline of a dark purple circle with white background, inside is a drawing of the silhouettes of six people clustered together.  This icon symbolizes the Community Level of the Social Ecological Model, explained elsewhere on the site.Community

Community Connectedness

Community Connectedness describes the strength and quality of social ties between members of a community and is a protective factor for all five forms of violence prioritized for prevention in NC.

One key component of Community Connectedness is collective efficacy.

Collective efficacy is a two-part concept that can be described as a willingness to intervene on behalf of the common good, plus a group-level “I think I can” – or rather, “we think we can.”

For more resources on Community Connectedness, visit our Resources section.


Positive School Climate and Connectedness

Levels of the Social Ecology:

 Outline of a dark purple circle with white background, inside is a drawing of the silhouettes of six people clustered together.  This icon symbolizes the Community Level of the Social Ecological Model, explained elsewhere on the site.CommunityOutline of a dark purple circle with white background, inside is a drawing of the silhouettes of two people standing together. This icon symbolizes the Interpersonal Level of the Social Ecological Model, explained elsewhere on the site.Interpersonal

School Climate and Connectedness

School climate is the “quality and character of school life.” It is the sum of the values, norms, expectations, and spaces that shape the social and physical environment of a school, making it a place that may feel safe and welcoming or hostile and intimidating.

School connectedness exists when children feel engaged with their school and cared for by school personnel. School climate and connectedness can be mutually reinforcing.

For more resources on School Climate and Connectedness, visit our Resources section.


Parent-Child Connectedness

Levels of the Social Ecology:

Outline of a dark purple circle with white background, inside is a drawing of the silhouettes of two people standing together. This icon symbolizes the Interpersonal Level of the Social Ecological Model, explained elsewhere on the site.InterpersonalOutline of a dark purple circle with white background, inside is a line-drawing of silouette of a person standing inside the circle. This icon symbolizes the Individual Level of the Social Ecological Model, explained elsewhere on the site.Individual

Parent Child Connectedness

According to researchers with ETR Associates, Parent-Child Connectedness “is characterized by the quality of the emotional bond between parent and child and by the degree to which this bond is both mutual and sustained over time."

When Parent-Child Connectedness is high in a family, the “emotional climate is one of affection, warmth, satisfaction, trust, and […] cohesion.” Although most of the available research deals with connections between parent and child, it is likely that the findings hold true for non-parental primary caregivers, such as grandparents who are raising their grandchildren.

For more resources on Parent-Child Connectedness, visit our Resources section.


Healthy Social and Emotional Development

Levels of the Social Ecology:

 Outline of a dark purple circle with white background, inside is a drawing of the silhouettes of two people standing together. This icon symbolizes the Interpersonal Level of the Social Ecological Model, explained elsewhere on the site.InterpersonalOutline of a dark purple circle with white background, inside is a line-drawing of silouette of a person standing inside the circle. This icon symbolizes the Individual Level of the Social Ecological Model, explained elsewhere on the site.Individual

Healthy Social and Emotional Development

The foundations of social, emotional, and behavioral health form in early infancy, and grow throughout adolescence. The Zero to Three: National Center for Infants, Toddlers, and Families describes social-emotional competence as “the developing capacity to experience and regulate emotions, form secure relationships, and explore and learn—all in the context of a child's family, community and cultural background.”

As children age, social emotional competence evolves to include self-confidence, motivation, and impulse control. Empathy, or the ability to identify and share the emotions of another person, also emerges in infancy. Empathy is affected by parental warmth, attachment, and emotional guidance. In addition to being crucial elements of violence prevention, these factors are essential to school readiness and healthy relationships.

For more resources on Healthy Social and Emotional Development, visit our Resources section.

Social determinants of health are physical and social structures that comprise the environmental backdrop of people’s lives, and can promote or undermine health and well-being. Together, these social determinants shape the quality of life for people across the tiers of the social ecology and determine whether people experience the risk or protective factors of the Key Strengths.

The term social ecology comes from public health, and describes the organic, interactive organization of people’s relationships within and across different sized groups. These relationships include individuals’ relationship to self, individuals with each other, as well as networks of communities all the way up to the whole of society.

There are lots of risk and protective factors that influence individuals’ and communities’ experiences of violence, and we’ve grouped them into six clusters that we call Key Strengths. Each cluster contains related influences that can be thought of as risk factors (when things aren’t going well for a person or community), or as protective factors (when things are going well).

Focusing our IPV prevention efforts on the Key Strengths is like using a specialized water-treatment strategy to address the contaminants in the groundwater – bolstering the protective factors and mitigating the risk factors pulls the water up from underground to whatever level of the social ecology a strategy aims to affect, shifts the social determinants of health to be more equitable, and then sends it back down a little cleaner so it can continue to benefit everyone, everywhere.

For each key strength, you will see data and statistics known as health indicators. These are measurable characteristics that demonstrate the health of a population (e.g. mortality rates or incidence) or a measurable factor that contributes to the health of a population (e.g. access to healthcare or socio-economic status.) The indicators included with each key strength are meant to illustrate what risk and protective factors look like within populations.

We use the indicators to determine whether public health violence prevention initiatives have positive outcomes for the people of NC. Current measures give us a snapshot of the health of a population in a community or state, and by looking at year over year differences in measurements we can see trends over time.


Intimate Partner Violence (IPV) in North Carolina — Current Statistics


Domestic Violence Related Homicides:

2023:  71
2022: 50
2021: 63
2020: 61
2019: 57
2018: 53

NCCADV tracks deaths resulting from intimate partner violence.  These include deaths from current or former intimate partners, as well as third parties killed because of family violence dynamics.

Source: North Carolina Coalition Against Domestic Violence - DV Homicides in NC
                           

Experiences of Psychological Violence:
   
Women 56.7%

Men 44.1%

These are percentages of adults in NC who have experienced psychological violence from an intimate partner in their lifetime.

Psychological aggression includes insulting, humiliating or making fun of a partner in front of others.  It also includes coercive control and entrapment, which includes behaviors that are intended to monitor, control, threaten and intimidate a current or former partner. 

Source: The National Intimate Partner and Sexual Violence Survey 2016/2017 State Report

2010-2012 State Report

Experiences of Physical or Sexual Violence, and/or Stalking:
   
Women 54.9%

 Men 40.4%

This data is a combination of multiple forms of violence by an intimate partner. 

These are percentages of adults in NC who have experienced physical or sexual violence and/or stalking in their lifetime.  

Physical violence includes a range of behaviors from pushing, slapping or shoving, to severe acts that include being hit with a fist or something hard, kicked, hurt by pulling hair, slammed against something, tried to hurt by strangulation or suffocating, beaten, burned on purpose, used a knife, and used a gun.

Contact sexual violence is a measure that includes rape, made to penetrate (cis males only), sexual coercion, and/or unwanted sexual contact.

Source: The National Intimate Partner and Sexual Violence Survey 2016/2017 State Report
2010-2012 State Report

Experiences of IPV before and during pregnancy:

In 2020, 4.8% of PRAMS respondents* 
experienced intimate partner violence during the 12 months before pregnancy by a current or former husband or partner.  (In 2019 this was 4.1%)

In 2020, 4.8% of PRAMS respondents* 
experienced intimate partner violence during pregnancy by a current or former husband or partner.  (In 2019 this was 2.5%)                                                               
*NC Pregnancy Risk Assessment Monitoring System(PRAMS) survey responses were given by birthing people before, during and after pregnancy.                     
Intimate partner violence (IPV) includes pushing, hitting, slapping, kicking, choking or other physical harm.                                           

Source: 2020 Pregnancy Risk Assessment Monitoring System(PRAMS) Survey Results  


PVNC Prevention Key Takeaways

Part of the PVNC logo which shows a dark blue sprig of honeysuckle vine growing in front of a partially-constructed brick wall that is a soothing light-blue.Violent behavior is complex

Effective violence prevention requires understanding the equally complex answers to these two simple questions:
1. Why does violence occur?
2. How do we prevent it?

Violence is about abuse of power and preventing violence is about addressing abuse of power at its roots. We’ve created an interactive theory of change to visually show the ways violence is rooted in systems of advantage and oppression. Systems of advantage and oppression create power imbalances in our society and are like contaminates in the groundwater that impact every aspect of life.


What is Primary Violence Prevention?

Violence Prevention can refer to preventing people from becoming victims of violence. It can refer to preventing people from becoming perpetrators of violence. Both of these forms of prevention can take place before the first incident ever occurs (primary prevention). Or they can take place later, to prevent violence from occurring again and to mitigate the immediate and long-term effects of violence (secondary and tertiary prevention).

Primary prevention is prevention of first-time perpetration. The goal of Prevent Violence NC is to support people working to prevent first-time perpetration of violence with resources and information to make their efforts more successful. The selected strategies are centered on ensuring people do not engage in violent behaviors. We do this by fostering individual, family, community, and societal supports and positive norms. We call these the Key Strengths.

Some definitions of primary prevention include strategies to prevent victimization. Strategies to prevent first-time victimization include things like recognizing and avoiding risk. Though these strategies may be considered part of a broader approach to violence prevention, PVNC specifically does not include these approaches for several important reasons:

  • They place responsibility for preventing violence on the potential victims of violence. This also can lead to victim blaming.
  • They do little to prevent someone who has not been reached by the prevention strategy from being victimized.
  • They tend to emphasize actions individuals can or should take to avoid violence, rather than addressing its root causes.
  • Victimization focused strategies only work to prevent people from becoming victims of violence. Perpetration focused prevention is more effective and more efficient because it addresses root causes and has the ability to stop both perpetration and victimization.

The result of this approach is less sustainable and more limited in reach. It fails to impact the systems, attitudes, and norms that allow violence to persist.

Image of purple flower with green leaves and a root system along with informational boxes. Purple box labels roots  as Inequality, oppression, and poverty are addressed as the essential first step to preventing violence at its roots. A lighter purple box labeled support says Systems, structures, policies and programs are built to grow community strengths and provide critical support. The lightest purple box labeled blooms says individuals, families, and communities are resilient, empowered, equitable, and peaceful.


Social Ecological Model

The public health approach to prevention uses models to help us understand the different factors that affect the health and wellbeing of individuals and populations. The Social Ecological Model, also called the social ecology, helps us to understand the various levels of influence on people’s lives. The term social ecology comes from public health, and describes the organic, interactive organization of people’s relationships within and across these different sized groups. On this version of the model, there are examples of the kinds of influences that exist at the individual, relationship, community, and societal levels. Often this model is illustrated using concentric circles or ovals.

Image of the Social ecological model. On the left side of the image there are different colored concentric semi-circles. The outermost layer is labeled Societal with the examples of policital systems, culture, and norms. The next layer is labeled Community with the examples of school, faith community, and community center. The next layer is labeled Interpersonal with the examples offamily, friends, and partners. And the innermost layer is labeled Individual with the examples of knowledge, attitudes, and habits.

When we are planning for violence prevention, we can use the social ecological as a tool to map and understand where various risk and protective factors occur in the social ecology and their level of influence on a populations’ violence outcomes. This also then helps us to understand what points of intervention might be most effective. When we talk about an ”upstream approach“ or “outer layers” in public health, we‘re talking about the community and societal levels. These are the levels we can work on to effect change that is both lasting and far reaching.


Risk and Protective Factors

One way that we can work to address violence where it begins is to use strategies that decrease risk factors and increase protective factors. Risk factors are the things that make it more likely that people with experience or perpetrate violence. Protective factors are the things that make violence less likely to happen or help to buffer against the impact of risk factors. Protective factors can also increase resilience.


Risk Factors:

  • INCREASE the likelihood a person will use violence. “They are contributing factors and may or may not be direct causes.” (CDC)
  • ARE NOT determinative. “Not everyone who is identified as at risk becomes a perpetrator of violence.” (CDC)


Protective Factors:

  • BUFFER against risk. They are conditions, characteristics, and influence that may decrease the likelihood of perpetrating or being the victim of violence.
  • ENCOURAGE a positive, health-promoting focus. They are at the core of asset-based or strengths-based prevention strategies.


Characteristics of Risk and Protective Factors

Because risk and protective factors help to explain and predict the likelihood of violence, they can be incredibly useful tools for developing violence prevention strategies. When developing a prevention strategy to address the risk or protective factors relevant to your community, there are some important things to keep in mind:

Shared Risk and Protective

Some risk and protective factors are associated with multiple forms of violence, as well as other health outcomes.

One of the major motivators behind the Prevent Violence NC website was to pull together information about shared risk and protective factors in an actionable way for preventionists. Since the initial development, we’ve integrated our understand of SRPF into a broader analysis of systemic and institutional power structures. This gives us a more nuanced understanding of what shapes risk and protective factors.

Focusing on these shared risk and protective factors is likely to:

  • Have an IMPACT on many outcomes
  • Increase opportunities for NEW PARTNERSHIPS and audiences
  • Increase the EFFECTIVENESS of our collaboration with partners
  • Allow advocates to LEVERAGE scarce prevention resources
  • ACKNOWLEDGE the complex reality in which violence takes place
  • EXPAND the notion of what constitutes violence prevention to include a larger selection of proven approaches to promote wellbeing

Researchers at the Centers for Disease Control and Prevention and the Prevention Institute outlined the advantages and importance of using shared risk and protective factors in violence prevention in their brief, Connecting the Dots: An Overview of the Links Between Multiple Forms of Violence. Focusing on shared risk and protective factors can be a highly effective and engaging way to structure a comprehensive violence prevention strategy because there:

  • are countless influences on violence
  • is a tendency for multiple forms of violence to co-occur within individuals, families, and communities
  • are limited resources available to address violence

Prevent Violence NC organizes a large set of risk and protective factors into a set of six Key Strengths for violence prevention. When nurtured and supported in communities, families, and individuals, each of these Key Strengths can help to prevent North Carolina’s five prioritized violence outcomes:

  • child maltreatment
  • intimate partner violence
  • sexual violence
  • suicide
  • youth violence

Read about how to use risk and protective factors and our Key Strengths to guide prevention efforts.


Developing a Prevention Strategy

This is an image of the public health model. There are four purple boxes arrange in a diagonal line from the bottom left of the image to the top right of the image. There are arrows between each box to denote that these are steps. The boxes say Define the problem, Identify risk and protective factors, Develop and test prevention strategies and Assure widespread adoption. There is a drawing of three houses, a road, a playground and some trees in the bottom right corner of the image.

Violence was once thought to be inevitable. It is now being increasingly recognized as a preventable, public health problem. The public health model for violence prevention recommends a four-step process to systematically approach violence. Developing a prevention strategy can be relatively straightforward or rather complex. Many excellent guides and resources, such as the Community Tool Box, are available online and in print. Below, you'll find basic guidance related to using risk and protective factors to begin developing or selecting a prevention strategy. Many of the examples and resources are specifically for prevention in the state of North Carolina. For more in-depth support on prevention program planning consider contacting North Carolina Coalition Against Domestic Violence or sending us a question through the contact form.

FIRST, LEARN ABOUT YOUR COMMUNITY TO MAKE SURE YOUR PREVENTION STRATEGY IS RELEVANT FOR YOUR COMMUNITY. Prevention cannot be a one-size-fits-all approach because different communities have different strengths and challenges and different cultures. In order to be successful, it is important that prevention efforts are relevant to your community and involve members of the community in a meaningful way. Before developing or selecting a prevention strategy, it is essential to assess which risk and protective factors are present, among which groups and individuals, and to understand your community’s readiness to address those risk and protective factors. There are several ways to do this.

Collect your own data: There are many ways to collect data in your community. It is important that when you are collecting data that you do so in a way that is accessible for the community, especially those who are most marginalized, and allows the community to define their own experience in a way that works for them. Below are some of the options for how to collect data in you community.

Using existing, secondary data sources: Secondary data sources refer to data and information that was collected by someone else and can provide information about the issue you are trying to address. Below are some examples of some larger datasets available in NC. You can also seek secondary data that is specific to your community through various community partners such as (but not limited to): local health departments, social services agencies, local government, local agencies that do research or evaluation, local school systems etc.

Learn from what others are doing: Understanding what other local organizations are prioritizing or working on can provide clues about which risk and protective factors may be relevant to the community – not to mention uncovering potential partners for your prevention work.
  • Attend conferences and workshops.
  • Join multidisciplinary task forces.
  • Join mailing lists.
  • Follow social media.

As you can see, there are several ways of gathering and learning information about your community. Each of these methods come with their own benefits and challenges. It is important to know what questions to ask that will help you understand what type of data you need to effectively prevent violence in your community. Some questions to consider are:

  1. What do you need to know about your community?
  2. Who do you need to learn from?
  3. How hard is it to know that information?
  4. How intensive will it be to get that information?
  5. Does somebody already have that information?

Secondary data is helpful for giving you a bird's eye view on an issue and the general frequency of different things happening within a community. Gathering primary data by talking to a community will help you understand the priorities and goals of the community, their perceptions and on why certain things are happening within the community, and their ideas regarding the best approach for making change. Through this process you may learn about violence prevention efforts that are already underway, that may or may not be called violence prevention. Learning about other efforts occurring in your community allows you to coordinate efforts, support existing efforts with various violence prevention resources, and increase your overall collective impact within your community.

Prioritizing Risk & Protective Factors

PRIORITIZE. FOCUS ON RISK AND PROTECTIVE FACTORS THAT ARE IMPORTANT, CHANGEABLE, FEASIBLE, AND HAVE BROAD IMPACT: When you have determined the set of risk and protective factors relevant to your community, you will likely need to narrow your list. In order to prioritize the factors your prevention work will address, involve community partners in determining:

One tool that can help you and your community prioritize which risk and protect factors you want to address is the prioritization matrix. When using it, place the risk and protective factors on the chart around how important and changeable they might be FOR YOUR COMMUNITY. This can be used as an interactive tool with your community to visually see how to prioritize your time and resources.

This is an image of the Risk and protective factor prioritization matrix. The concepts on this matrix are situation on a graph that is divided into four quadrants. The y axis is labels from low importance to high importance and the x axis is labeled from low changeability to high changeability. The high importance/low changeability quadrant says Moderate priority (potential for high impact, but needs innovative program development & evaluation). The high importance/high changeability quadrant says High Priority. The low importance/low changeability quadrant says Low Priority, and the Low importance/high changeability quadrant says Moderate priority (low cost, minimal effort, but smaller impact).

If something is high changeability AND high importance that’s where we want to devote most of our time, energy, and funds. These are the things that will move us towards our goals as effectively as possible.

It’s really tempting to only ever go after the HIGH importance HIGH Changeability and HIGH Changeability LOW importance because our funding requires quick turn arounds and quick success. It’s important to also do HIGH Importance and LOW changeability because these are very sustainable once we’ve made the change. That’s why it’s hard to change in the first place. When we are planning our prevention efforts it’s really important for us to be thinking past the 1-5 year time frame to the long term to be putting in place the building blocks that will allow us to be able to make the bigger, more sustainable, deeper changes…

Part of the PVNC logo which shows a dark blue sprig of honeysuckle vine growing in front of a partially-constructed brick wall that is a soothing light-blue.Prevention is a LONG TERM process

For a blank printable worksheet of the prioritization matrix, click here.


Health Impact Pyramid

Image of the Health impact pyramid. The bottom layer of the pyramid says Socioeconomic Factors. The next layer says Changing the context to make individuals default decision healthy. The next layer says Long lasting protective interventions. The next layer says Clinical Interventions. And the top layer says Counseling and Education.

Once you have prioritized which risk and protective factors to address in your community, it’s time to select, plan, and implement the strategies you will use to address them. The PVNC strategies section can give you some ideas on approaches and programs. Another tool that can help you select or develop an effective and impactful strategy is the Health impact pyramid.

9 Principles of Effective Prevention Programs
When considering what programs or strategies you want to use to address your prioritized risk and protective factors, another set of guidance to consider the 9 Principles of Effective Prevention Programs.


Special thanks to Dr. Beth Moracco, PhD at the University of North Carolina Gillings School of Global Public Health

This article is for testing only.

PVNC Strategies Key Takeaways

Strategies that focus on broad cultural and structural change at the community and societal levels will have greater impact over time and can serve to sustain the results of strategies aimed at individual and interpersonal transformation.

The level of the social ecology a strategy operates on can change depending on the specific contextual details of its implementation.

Part of the PVNC logo which shows a dark blue sprig of honeysuckle vine growing in front of a partially-constructed brick wall that is a soothing light-blue.Social Ecology is a term used in public health to describe social influences that occur among different sized groups of people.

Each societal group is called a different “level” in the social ecology. Going from largest to smallest, they are:

Outline of a dark purple circle with white background, inside is a drawing of a building with a car driving in front of it and green pine trees in the background. This icon symbolizes the Societal Level of the Social Ecological Model, explained elsewhere on the site.Societal Level

Outline of a dark purple circle with white background, inside is a drawing of the silhouettes of six people clustered together.  This icon symbolizes the Community Level of the Social Ecological Model, explained elsewhere on the site.Community Level

Outline of a dark purple circle with white background, inside is a drawing of the silhouettes of two people standing together. This icon symbolizes the Interpersonal Level of the Social Ecological Model, explained elsewhere on the site.Interpersonal Level

Outline of a dark purple circle with white background, inside is a line-drawing of silouette of a person standing inside the circle. This icon symbolizes the Individual Level of the Social Ecological Model, explained elsewhere on the site.Individual Level

Some scholars add a broader level, the cultural level, and describe it as a layer that encompasses the institutions and structures of the societal level.

We have labeled each strategy according to the level of the social ecology it is most likely to affect, but this is not a hard-and-fast categorization – there are ways to influence each Key Strength at every level of the social ecology. And - the strategies can be adapted! If you would like support navigating an adaptation of a strategy to shift it toward the community or societal level, please reach out to us via our contact form.

A note about the methods:
The strategies highlighted throughout the Prevent Violence NC website are those that have demonstrated or indicate a likelihood of success changing the prioritized, shared risk and protective factors. These strategies have not necessarily been evaluated for their effectiveness on the prioritized violence outcomes. However, given the research linking the risk and protective factors to the violence outcomes, we have reason to believe that modifying the risk and protective factors will ultimately have an impact on the occurrence of violence.

One goal of Prevent Violence NC is to continue to call attention to areas like this, where more funding is needed to support research and community-level evaluation.


Key Strength: Norms Related to Gender and Power

Levels of the Social Ecology:

Outline of a dark purple circle with white background, inside is a drawing of a building with a car driving in front of it and green pine trees in the background. This icon symbolizes the Societal Level of the Social Ecological Model, explained elsewhere on the site.Societal Outline of a dark purple circle with white background, inside is a drawing of the silhouettes of six people clustered together.  This icon symbolizes the Community Level of the Social Ecological Model, explained elsewhere on the site.Community Outline of a dark purple circle with white background, inside is a drawing of the silhouettes of two people standing together. This icon symbolizes the Interpersonal Level of the Social Ecological Model, explained elsewhere on the site.Interpersonal Outline of a dark purple circle with white background, inside is a line-drawing of silouette of a person standing inside the circle. This icon symbolizes the Individual Level of the Social Ecological Model, explained elsewhere on the site.Individual

Social norms that shape gender roles exist at a cultural and societal level, but they are often taught and enforced at the interpersonal and community levels. For example, children may be teased by peers for showing interest in toys or clothing that don’t align with their assigned gender, and parents often limit the sports or other social activities their children may participate in based on gendered expectations. Educational and communications campaigns function at the interpersonal and community levels, while efforts to increase the number of women in societal decision-making roles operate at the community and societal level. Together, these strategies can begin to shift culture.

For more resources on Norms Related to Gender and Power, visit our Resources section.


Key Strength: Economic Stability & Opportunity

Levels of the Social Ecology:

Outline of a dark purple circle with white background, inside is a drawing of a building with a car driving in front of it and green pine trees in the background. This icon symbolizes the Societal Level of the Social Ecological Model, explained elsewhere on the site.SocietalOutline of a dark purple circle with white background, inside is a drawing of the silhouettes of six people clustered together.  This icon symbolizes the Community Level of the Social Ecological Model, explained elsewhere on the site.Community

Economic Stability and Opportunity can be understood as having enough material resources to provide for your, and your family’s basic needs, and ample, viable opportunities to improve your economic status. In terms of employment, it is having a steady job that pays a living wage or better, and ample opportunity in your neighborhood for everyone who needs such a job to obtain one. The strategies that are used to build this key strength tend to be at the community and societal level of the social ecology. Diminished economic opportunity and high unemployment not only reduce the potential for individual stable employment - but are also linked to greater community disorganization, and lower social cohesion and trust. Research has shown that communities that have been systematically dis-invested from economic resources and opportunities have higher rates of violence.

For more resources on Economic Stability & Opportunity, visit our Resources section.


Key Strength: Community Connectedness

Levels of the Social Ecology:

Outline of a dark purple circle with white background, inside is a drawing of the silhouettes of six people clustered together.  This icon symbolizes the Community Level of the Social Ecological Model, explained elsewhere on the site.Community

Strategies to increase community connectedness most often function at the community level of the social ecology, although wide-scale changes to the built environment at the societal level may also serve to connect community members.

For more resources on Community Connectedness, visit our Resources section.


Key Strength: Positive School Climate and Connectedness

Levels of the Social Ecology:

 Outline of a dark purple circle with white background, inside is a drawing of the silhouettes of six people clustered together.  This icon symbolizes the Community Level of the Social Ecological Model, explained elsewhere on the site.CommunityOutline of a dark purple circle with white background, inside is a drawing of the silhouettes of two people standing together. This icon symbolizes the Interpersonal Level of the Social Ecological Model, explained elsewhere on the site.Interpersonal

School Climate and Connectedness is about creating supportive and welcoming school environments in which students feel engage and cared for by the school personnel and their peers. The strategies that are used to build this key strength tend to be at the interpersonal and community level. Interpersonal strategies can be very important for the development of strong emotional and relationship skills that are important for healthy relationships within the school environment and beyond. However, because there is regular turnover within the school population, the strategies at this level have limited ability to affect school climate and connectedness in a lasting way. Community efforts, such as supportive, school-wide policies and partnerships with community partners that help bolster supports across the community, are the most effective at making sustainable growth towards positive school climate and connectedness.

For more resources on Positive School Climate and Connectedness, visit our Resources section.


Key Strength: Parent-Child Connectedness

Levels of the Social Ecology:

 Outline of a dark purple circle with white background, inside is a drawing of the silhouettes of two people standing together. This icon symbolizes the Interpersonal Level of the Social Ecological Model, explained elsewhere on the site.InterpersonalOutline of a dark purple circle with white background, inside is a line-drawing of silouette of a person standing inside the circle. This icon symbolizes the Individual Level of the Social Ecological Model, explained elsewhere on the site.Individual

Most initiatives to support parent-child connectedness are education or counseling programs working with parents and children at the interpersonal or individual levels. However, some strategies work more broadly to facilitate stronger parent-child positive bonds, such as policies that increase the amount of time working parents have available to spend with their children. In addition, there are strategies that help to build community networks that support families in building safe and supportive home environments.

For more resources on Parent-Child Connectedness, visit our Resources section.


Key Strength: Healthy Social and Emotional Development

Levels of the Social Ecology:

 Outline of a dark purple circle with white background, inside is a drawing of the silhouettes of two people standing together. This icon symbolizes the Interpersonal Level of the Social Ecological Model, explained elsewhere on the site.InterpersonalOutline of a dark purple circle with white background, inside is a line-drawing of silouette of a person standing inside the circle. This icon symbolizes the Individual Level of the Social Ecological Model, explained elsewhere on the site.Individual

Healthy social and emotional development helps individuals manage difficult situations and learn to solve interpersonal problems without engaging in violence. The most common strategies to address this key strength focus on influencing risk and protection at individual and interpersonal levels, but there are also ways to affect this key strength with social policy and community-wide efforts.

Research on Adverse Childhood Experiences (ACEs) has shown a correlation between experiencing social-environmental difficulties as a child and numerous health conditions in adulthood. The protective factors that fall under this key strength can be especially challenging to foster when the surrounding environment is unstable, threatening, or traumatizing, and the events that qualify as ACEs occur at much higher rates among communities that have been systematically marginalized. The “Pair of Aces” model depicts the interconnectedness of Adverse Community Environments and Adverse Childhood Experiences, highlighting importance of addressing this Key Strength across all levels of the social ecology as well as in the “groundwater” of structure and culture.

For more resources on Healthy Social and Emotional Development, visit our Resources section.