Social determinants of health are physical and social structures that comprise the environmental backdrop of people’s lives, and can promote or undermine health and well-being. Together, these social determinants shape the quality of life for people across the tiers of the social ecology and determine whether people experience the risk or protective factors of the Key Strengths.
The term social ecology comes from public health, and describes the organic, interactive organization of people’s relationships within and across different sized groups. These relationships include individuals’ relationship to self, individuals with each other, as well as networks of communities all the way up to the whole of society.
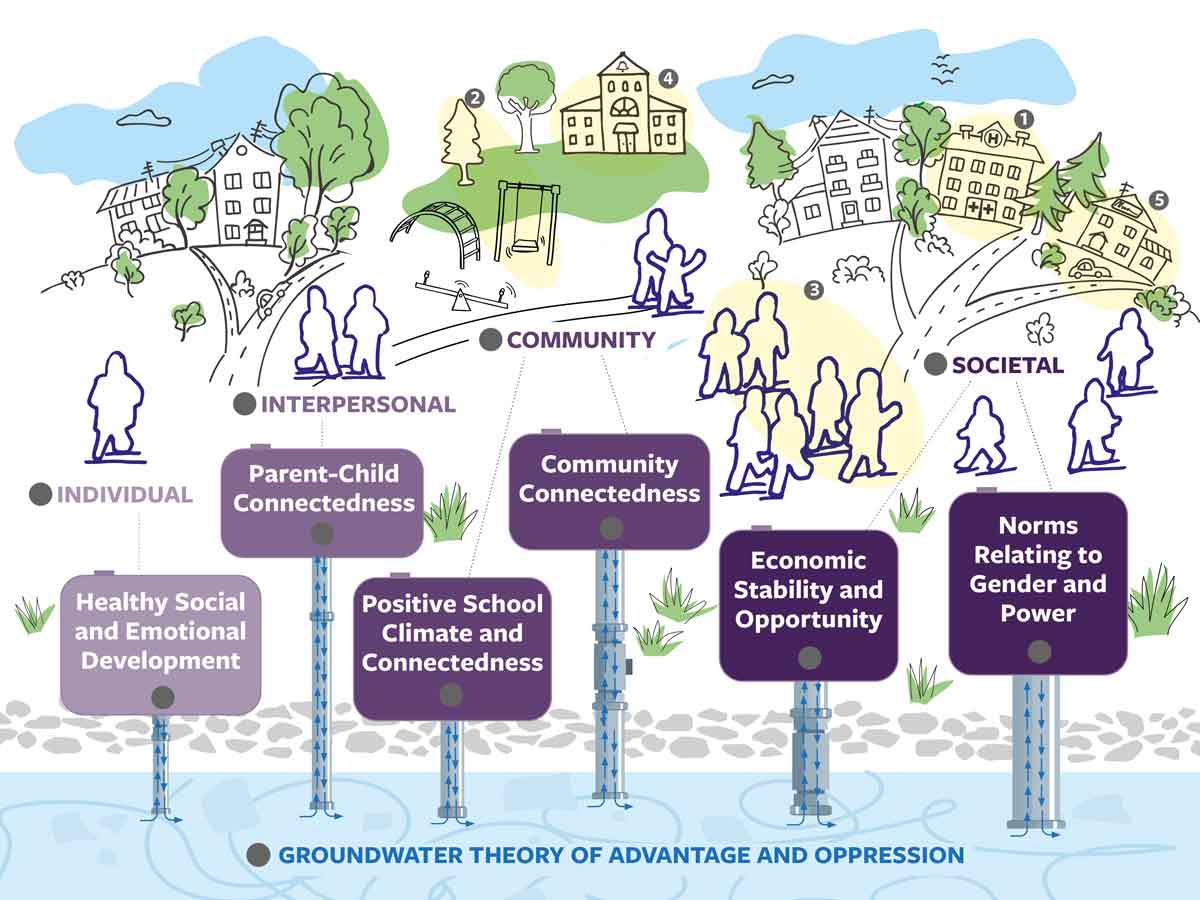
There are lots of risk and protective factors that influence individuals’ and communities’ experiences of violence, and we’ve grouped them into six clusters that we call Key Strengths. Each cluster contains related influences that can be thought of as risk factors (when things aren’t going well for a person or community), or as protective factors (when things are going well).
Focusing our IPV prevention efforts on the Key Strengths is like using a specialized water-treatment strategy to address the contaminants in the groundwater – bolstering the protective factors and mitigating the risk factors pulls the water up from underground to whatever level of the social ecology a strategy aims to affect, shifts the social determinants of health to be more equitable, and then sends it back down a little cleaner so it can continue to benefit everyone, everywhere.
For each key strength, you will see data and statistics known as health indicators. These are measurable characteristics that demonstrate the health of a population (e.g. mortality rates or incidence) or a measurable factor that contributes to the health of a population (e.g. access to healthcare or socio-economic status.) The indicators included with each key strength are meant to illustrate what risk and protective factors look like within populations.
We use the indicators to determine whether public health violence prevention initiatives have positive outcomes for the people of NC. Current measures give us a snapshot of the health of a population in a community or state, and by looking at year over year differences in measurements we can see trends over time.
Intimate Partner Violence (IPV) in North Carolina — Current Statistics
Domestic Violence Related Homicides:
2023: 71
2022: 50
2021: 63
2020: 61
2019: 57
2018: 53
NCCADV tracks deaths resulting from intimate partner violence. These include deaths from current or former intimate partners, as well as third parties killed because of family violence dynamics.
Source: North Carolina Coalition Against Domestic Violence - DV Homicides in NC.
Experiences of Psychological Violence:
Women 56.7%
Men 44.1%
These are percentages of adults in NC who have experienced psychological violence from an intimate partner in their lifetime.
Psychological aggression includes insulting, humiliating or making fun of a partner in front of others. It also includes coercive control and entrapment, which includes behaviors that are intended to monitor, control, threaten and intimidate a current or former partner.
Source: The National Intimate Partner and Sexual Violence Survey 2016/2017 State Report
2010-2012 State Report
Experiences of Physical or Sexual Violence, and/or Stalking:
Women 54.9%
Men 40.4%
This data is a combination of multiple forms of violence by an intimate partner.
These are percentages of adults in NC who have experienced physical or sexual violence and/or stalking in their lifetime.
Physical violence includes a range of behaviors from pushing, slapping or shoving, to severe acts that include being hit with a fist or something hard, kicked, hurt by pulling hair, slammed against something, tried to hurt by strangulation or suffocating, beaten, burned on purpose, used a knife, and used a gun.
Contact sexual violence is a measure that includes rape, made to penetrate (cis males only), sexual coercion, and/or unwanted sexual contact.
Source: The National Intimate Partner and Sexual Violence Survey 2016/2017 State Report
2010-2012 State Report
Experiences of IPV before and during pregnancy:
In 2020, 4.8% of PRAMS respondents*
experienced intimate partner violence during the 12 months before pregnancy by a current or former husband or partner. (In 2019 this was 4.1%)
In 2020, 4.8% of PRAMS respondents*
experienced intimate partner violence during pregnancy by a current or former husband or partner. (In 2019 this was 2.5%)
*NC Pregnancy Risk Assessment Monitoring System(PRAMS) survey responses were given by birthing people before, during and after pregnancy.
Intimate partner violence (IPV) includes pushing, hitting, slapping, kicking, choking or other physical harm.
Source: 2020 Pregnancy Risk Assessment Monitoring System(PRAMS) Survey Results